A 2-D mapping (or Bullseye Display) of the 3-D myocardium function from myocardial perfusion SPECT (single photon emission computed tomography). For a normal heart function, the grey scale of the circular display would be relatively uniform. On the left is the conventional reconstruction of the myocardium function, where two defects are barely seen. On the right is the result of our quantitative reconstruction, where the two defects are not only clearly seen, but also quantitatively defined in their sizes and intensities. The reconstruction is of 128 cubic size. Our current quantitative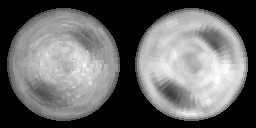 reconstruction is based on MAP-EM (maximum a posteriori probability with expectation-maximization) iterative algorithm.
With the explicit inversion formula of Novikov for the attenuated Radon transform, quantitative chest SPECT (i.e., with additional scatter compsenation and collimator blurring correction) can be reconstructed by an ultrafast speed because of the analytical inversion nature. In parallel-beam collimation geometry, the reconstruction accuracy and ultrafast speed have been observed. For varying focal-length fan-beam collimation geometry, our recent results are very encouraging, see our publications.
Comparison of our quantitative SPECT (single photon emission computed tomography) reconstruction (right) with the conventional reconstruction (left) for the 3-D Hoffman brain model. The reconstruction is of 128x128x32 array size. Our quantitative reconstruction is fully analytic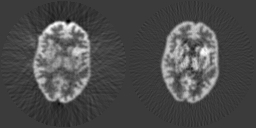 al in numerical calculation and statistical in modeling the Poisson noise and minimizing the cost function. A unique feature of our approach is that the transmission scans are not needed (althought transmission scans are usually required for photon attenuation compensation in SPECT).
By the NIH R01-NS33853 support, quantitative brain SPECT with optimized fan-beam collimation, without transmission scans and in an ultrafast speed has been established. For details, please see our publication in IEEE Transactions on Medical Imaging, February, 2005.
Please see our publication in IEEE Transactions on Medical Imaging, June, 1994.
Sinogram-restoration approach provides an efficient way to handle the physics and statsistics issues and to utilize the well-established FBP (filtered backprojection) to invert mathematically the Radon transform.
Please see our publication in IEEE Transactions on Nuclear Science, October, 2004.
Establishing penalized weighted least-squares cost function with known variance-mean relationship and spatial correlation in the sinogram domain is one fundamental issue in our approach. Reducing the high dimensions and considering the spatial correlation by K-L transform is another fundamental point in our approach. Utilizing the well-established FBP (filtered backprojection) to invert exactly the Radon transform is a big benefit for so large data volume in CT applications.
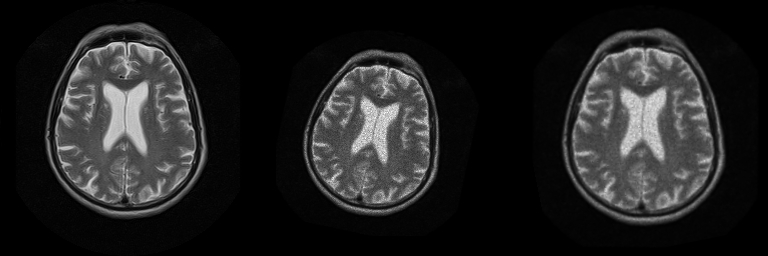
On the bottom is a patient head image acquired by a MR (magnetic resonance) scanner when he/she first visited the hospital. After several months of treatment, the patient visited the hospital again for examination. An image was then acquired, as shown in the middle. To evaluate the effectiveness of the treatment, both images should be matched by an automatic means. Our developed automatic technique achieved the excellent match, as shown on the right.
On the bottom are computerized segmentation of cerebrospinal flow (CSF), brain tissues (white and grey matters), and functionally altered brain tissues from magnetic resonance (MR) diffusion images of a stroke patient. On the bottom are the corresponding results using a conventional threshold method with intensive user interaction. Our automatic method performs comparatively to the user interaction.
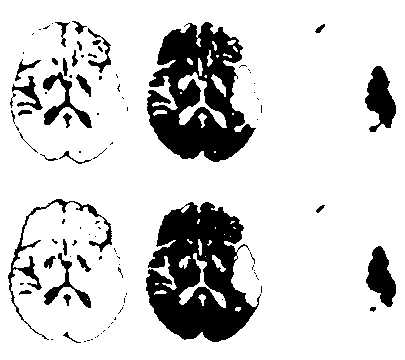
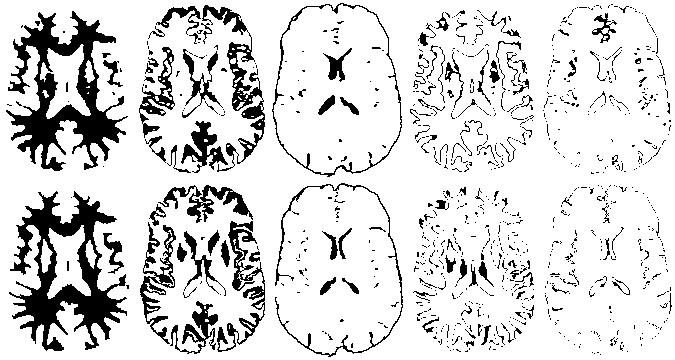
On the bottom are computerized mapping of white matter, grey matter, cerebrospinal flow (CSF), mixture of white and grey matters, and mixture of grey matter and CSF from a set of T1, T2, and proton-density weighted magnetic resonance (MR) images. On the bottom are the corresponding atlas from textbook, which were generated by neuroradiologists from the same set of MR images. Our computerized means performs comparatively to the experts's hand-drawing atlas.
This research is a joint project with Statistics Dept of Univ of Mass at Amhurst.
Virtual Endoscopy uses non-invasive imaging means to acquire images of the body and applies computer technology to navigate inside the body, searching for any desirable information.
- Electronic Colon Cleansing - Electronic colon cleansing uses contrast solutions which are mixed with food to enhance the colonic materials in the abdominal images. Then it removes the enhanced materials by image segmentation. On the left shows the enhanced materials inside the colon (indicated by the arraws) of a volunteer CT (computed tomography) image. The segmented results are shown on the right. This technique will simplify the bowel preparation and reduce false diagnosis in virtual colonoscopy.
- Fly-Path Planning - Fly-path planning consists of steps: (1) segmenting the colon wall (top left), (2) shrinking the original space to a small scale (top middle), (3) thinning for the trend of a pipe (top right), (4) determining a smooth path in the small scale space (bottom left), and (5) mapping back to the original space for the fly path (bottom right). An excellent fly path is very important to achieve virtual colonoscopy.
- Virtual Colonoscopy - Virtual colonoscopy developed by the Departments of Radiology, School of Medicine (SOM) and Computer Science, College of Engineering and Applied Sciences (CEAS) of SUNY at Stony Brook. Top left is a navigation of three simulated polyps inside a pipe phantom and top right is a navigation of a suspected abnormality inside the colon of the Visible Male. Others are the comparison of our virtual colonoscopy with conventional optical colonoscopy for a patient study (from middle left to right are a 4mm polyp in virtual colonoscopy and optical colonoscopy, and the location of the polyp in virtual colonoscopy and optical colonoscopy). On the bottom are a 8mm polyp and its location inside the patient's colon.
- Virtual Cystoscopy - MRI-based virtual cystoscopy. In the middle is an outside view of the whole bladder volume. A plane cuts the volume in the middle, as indicated by the blue color. On the left shows the left half of the bladder wall. The inner surface can be clearly viewed. On the right shows the right half of the wall. This is a non-invasive, cost-effective, and comfortable procedure for early detection of bladder cancer.
- Virtual Laryngoscopy - MRI-based virtual cystoscopy. In the middle is an outside view of the whole bladder volume. A plane cuts the volume in the middle, as indicated by the blue color. On the left shows the left half of the bladder wall. The inner surface can be clearly viewed. On the right shows the right half of the wall. This is a non-invasive, cost-effective, and comfortable procedure for early detection of bladder cancer.